India’s debt: Signs of alarm bells
By Philip Mudartha
Bellevision Media Network
25 Jul 2022: Following the alarming economic melt-down in neighboring Sri Lanka, there are voices in India predicting gloom and doom scenario for our economy. What is the reality on the ground? Because Sri Lanka is caught up in a debt-trap and a man-made economic crisis, should we worry about our own national debt? This essay attempts to look at the facts and figures and come out with certain conclusions.
How much is India’s debt?
Let me quote from the press release of RBI dated 30th June 2022: The stock of external debt at end-March 2022 as well as revised data for earlier quarters are summarized here. The major developments relating to India’s external debt as at end-March 2022 are presented below.
• At end-March 2022, India’s external debt was placed at US$ 620.7 billion, recording an increase of US$ 47.1 billion over its level at end-March 2021.
• The external debt to GDP ratio declined to 19.9% at end-March 2022 from 21.2% at end-March 2021.
• At end-March 2022, long-term debt (with original maturity of above one year) was placed at US$ 499.1 billion, recording an increase of US$ 26.5 billion over its level at end-March 2021.
• The share of short-term debt (with original maturity of up to one year) in total external debt increased to 19.6% at end-March 2022 from 17.6% at end-March 2021. Similarly, the ratio of short-term debt to foreign exchange reserves increased to 20.0% at end-March 2022 from 17.5 % at end-March 2021.
• Short-term debt on residual maturity basis (i.e., debt obligations that include long-term debt by original maturity falling due over the next twelve months and short-term debt by original maturity) constituted 43.1% of total external debt at end-March 2022 and stood at 44.1% of foreign exchange reserves.
• Outstanding debt of both government (public debt or sovereign debt) and non-government sectors (private debt) increased during 2021-22.
• The share of outstanding debt of non-financial corporations in total external debt was the highest at 40.3% followed by deposit-taking corporations (except RBI) at 25.6%, general government (sovereign debt) at 21.1% and other financial corporations at 8.6%.
• Loans remained the largest component of external debt, with a share of 33.0 %, followed by currency and deposits at 22.7%, trade credit and advances at 19.0% and debt securities at 17.1%.
• Debt service (i.e., principal repayments and interest payments) declined to 5.2 % of current receipts at end-March 2022 as compared with 8.2% at end-March 2021, reflecting lower repayments and higher current receipts.
• US dollar denominated debt remained the largest component of India’s external debt, with a share of 53.2% at end-March 2022, followed by debt denominated in the Indian rupee at 31.2%, SDR at 6.6% Yen at 5.4% and Euro at 2.9%.
The foreign exchange reserves at US$ 580.3 billion on July 8, 2022 were equivalent to 9.5 months of imports projected for 2022-23. The forex reserves are comfortable to service the debt (make scheduled repayments and make interest payments.
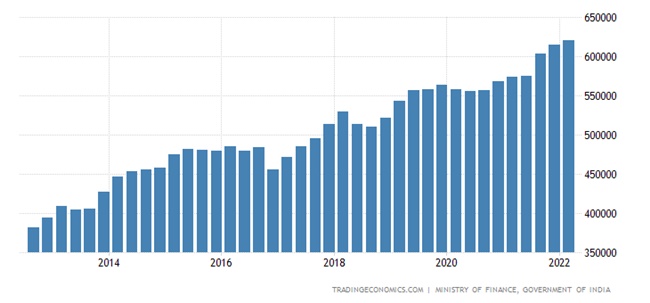
Trend of our external debt in USD over a decade
However, it should be noted that under PM Modi’s tenure since 2014, rate of external borrowing has accelerated. As global inflation has soared and interest rates have soared correspondingly, the outflow for debt servicing would increase. As stated in the RBI press release quoted above, 44.1% of forex reserves are needed to repay USD 267 billion of external debt within nine months (out of the total of USD620.7 billion).
Despite the rise in our share of global trade, we import more than we export. The merchandise balance of trade (exports-imports) will continue to be negative. Adding to our woes is the high crude oil prices which are unlikely to remain high until the Ukraine War continues. In sum, we will have to continue hard currency borrowings to finance the trade deficit.
Further, foreign investors in our stock market have become net sellers, repatriating several billions of dollars since October 2021 owing to higher bond yields in US and better performing economies like Brazil, Indonesia, Thailand and Malaysia. The increased forex inflows from remittances by Indian diaspora are unlikely to help much.
Dues to these reasons, the Indian Rupee will continue to depreciate and spiral towards 1USD= Rs 82 before the end of the year 2022 if not earlier.
Honor thy national debt:
External debt described above is only a small portion of the total National debt, also called government debt or public debt, is money owed by the federal government. It can be divided into internal debt, (which is owed to lenders in the country) and external debt (which is owed to foreign lenders). National debt is created and increased by using government bonds, for example, or by borrowing money from other nations. A quite complex issue, national debt is expected to be paid back in accordance with certain regulations overseen by the Bank for International Settlements (BIS), a financial organization owned by central banks.
India’s debt is rising:
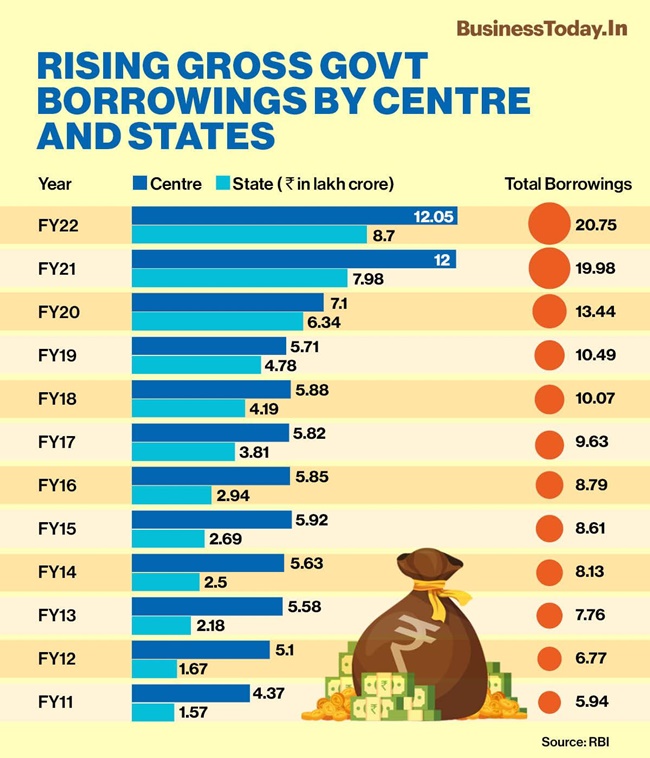
Government borrowing to finance the fiscal deficits
Last year, India’s debt was around ?147 lakh crore against this year’s estimated GDP of ?194 lakh crores. During FY2021-22, the Centre planned to borrow another ?12 lakh crore. The cumulated debt will be 89% GDP.
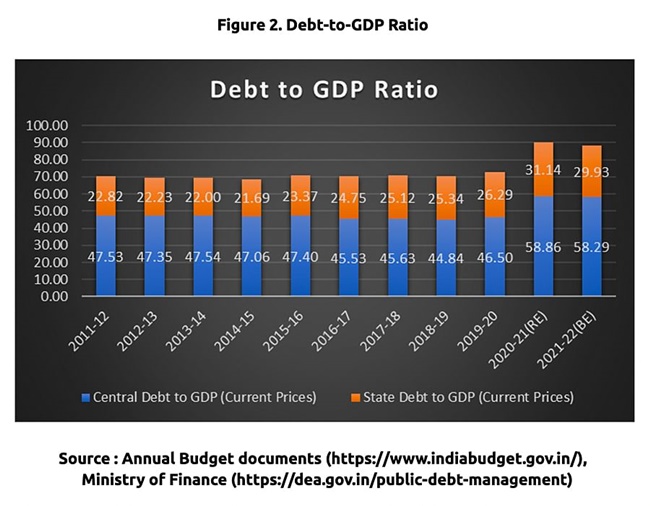
Explanation: The total government debt was steady at around 70% of the GDP from 2011-12 to 2018-19, before a sudden jump to 90 % in 2020-21. In 2015-16, the distribution of this total debt between central and state government debt changed a little as the central debt went down by 1-2% and the state debt increased by that same amount.
In 2019-20, the total debt inched up to 72% of the GDP and then the pandemic struck. In FY 2020-21, the GDP fell while the fiscal deficit jumped to 9.4%. This was a double assault on the debt-to-GDP figure, as the numerator increased more than it typically did each year, and the denominator reduced. As a result, the ratio soared to 90%. Even with the improved revenue expectation for FY 21-22 and the expected 9.2% growth in GDP, the debt ratio will only come down to 89%.
So, what do these charts convey? And is the steep rise in government debt over the last two years a cause for concern?
There are two recent government reports that provide some contesting insights and answers.
In 2016, a committee of economic experts headed by NK Singh was formed to recommend changes to the Fiscal Responsible and Budget Management Act with an eye towards fiscal prudence. To understand the evolving consensus on public debt in India, it is useful to trace the background of the FRBM Act.
The act was first passed in August 2003, in response to growing debt in the late 1990s when the annual fiscal deficit rose to over 10% of the GDP. There was a growing realization among economists and policymakers that a formal roadmap with legal backing was needed to force fiscal discipline. The FRBM Act set targets to reduce annual deficits in a phased manner, with a goal of bringing down the annual fiscal deficit to 3% of the GDP by March 2009.
After the enactment of the FRBM Act, there was a clear improvement in the fiscal position of the government. In fact, the central government deficit declined to 2.5% of the GDP in 2008-09 a year in advance from when the 3% deficit target was to be achieved. The debt-to-GDP ratio also declined during this period from 83% in 2002-02 to 71% in FY 2007-08. (The UPA-1 government takes credit for this achievement. The left parties take credit too, because UPA-1 had outside support of them. Then Finance Minister P. Chidambaram claims this achievement as his legacy).
Then the global financial crisis hit in 2008. Fiscal targets were put on hold as the government had to inject stimulus to counter the crisis. Even after the financial crisis passed, fiscal consolidation was not a top priority and the FRBM was amended in 2012 and 2015 to dilute the fiscal constraints set by the act.
In this context, the FRBM review committee of 2016 was formed, which submitted its report in January, 2017. Many of its core recommendations are pertinent:
“The Committee believes that a transparent and predictable policy framework is one that is rule-based. Central to a credible framework is the concept of an anchor. An anchor ties down the final goal of policy, and the expectations of economic agents adjust accordingly. By acting as a constraint on policy discretion, an anchor dis-incentivizes time inconsistency, including due to pressures from interest groups. There are four key economic arguments that form the basis for moving to debt. First, the standard government solvency constraint suggests debt to be the ultimate objective of fiscal policy. Second, there was broad consensus that a debt ceiling combined with fiscal deficit as an operational target can jointly provide a robust fiscal framework for India. Third, India, with a public debt close to 70% of GDP, currently stands out as among the most indebted countries amongst the relevant peer group of emerging markets. Finally, public debt exemplifies an important factor in the assessments of rating agencies. In addition to these economic arguments, a non-economic, albeit powerful and convincing rationale for moving to debt as the anchor put forth by several members of the committee, and considered to be particularly relevant in the Indian ethos, was that ’debt’ and ’debt repayments’ are concepts that can be communicated easily to the public, and are also embedded in the psyche of the ordinary citizen.”
Thus, the committee strongly advocated targeting a certain debt-to-GDP ratio as a policy objective. It argued that the benefits of having such a rule-based constraint far outweighed the drawbacks. The committee also laid out a roadmap to reduce total debt (central and state governments) from 70% the GDP in 2017 to around 60% of the GDP in 2023, with central government debt coming down to roughly 40% and the state governments’ debt staying at roughly 20% of the GDP.
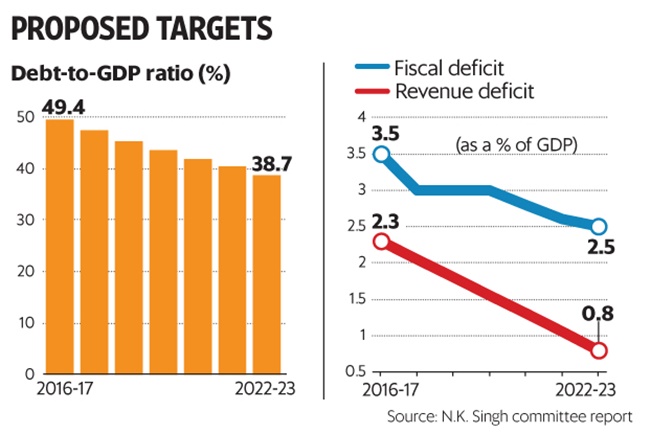
NK Singh Committee targets on Debt management
We know too well; the reality is quite the opposite:
Finance Minister Nirmala Sitharaman has chosen the path of debt-fueled growth over fiscal prudence. The focus should have been to quickly glide back to a pre-Covid fiscal deficit of around 3.0% of the GDP with a focus on lowering the debt-to-GDP ratio.
Instead, the Economic Survey of 2020-21 opts for relaxing strict debt and deficit targets to allow the government some fiscal space to increase spending, even if that means higher levels of debt.
Building upon the theory proposed by French economist Oliver Blanchard in his 2019 presidential address to the American Economic Association, the Economic Survey’s argument hinges on the relatively low cost of borrowing. According to Blanchard, as long as the economic growth rate is higher than the interest paid on government debt, there is no risk of debt explosion. This measure – the interest rate-growth differential, or IRGD – really determines the leeway a country has in incurring debt as well as the ease with which it can reduce its debt-to-GDP ratio.
The effect of IRGD can be understood with this basic illustration from the Economic Survey.
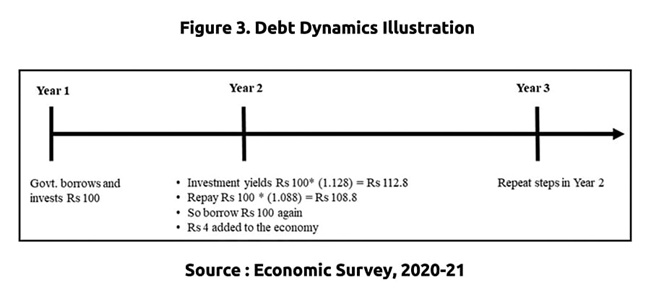
In the example given in Figure-3 above, the IRGD is 8.8% minus 12.8% = -4.0%. As long as IRGD is negative, debt will boost GDP growth. In other words, in low interest rate regime, borrow to spend on high returns wealth creation activities.
But the interest rates are rising now
The budget document targets fiscal deficit in FY 2022-23 at 6.4% of GDP, lower than the revised estimate of 6.9% of GDP in FY 2021- 22. Interest expenditure is estimated at Rs 9,40,651 crores which is about 43% of revenue receipts.
That was before the Fed Taper in the US, before the shocks of Ukraine War and before the supply chain disruptions caused by newer geo-political tensions with Russia and China. There is entirely a new reality now.
Will the Oliver Blanchard economic growth theory hold good? Or conventional wisdom, “never a borrower nor a lender be” or “stretch your feet within the mat” is what is needed for “now”?
Conclusion:
There are visible signs of distress in the economy with inflation soaring, household savings rate declining and rising unemployment. A few “wrong policy steps” such as the disruptive farm laws (which have been repealed), enacting socio-cultural laws promoting political polarization and creating social disharmony (such as NRC, CAA, Common Civil Code, etc.) and autocratic steps such as demonetization, lowering of corporate tax rates to benefit the big business could push the country over the debt abyss. It is hoped that the national and state level political leadership, collectively, aware of the risks involved.
 Write Comment |
  E-Mail To a Friend |
 Facebook |
 Twitter |
 Print
Print 


